Forecast update for Gold -22-04-2025
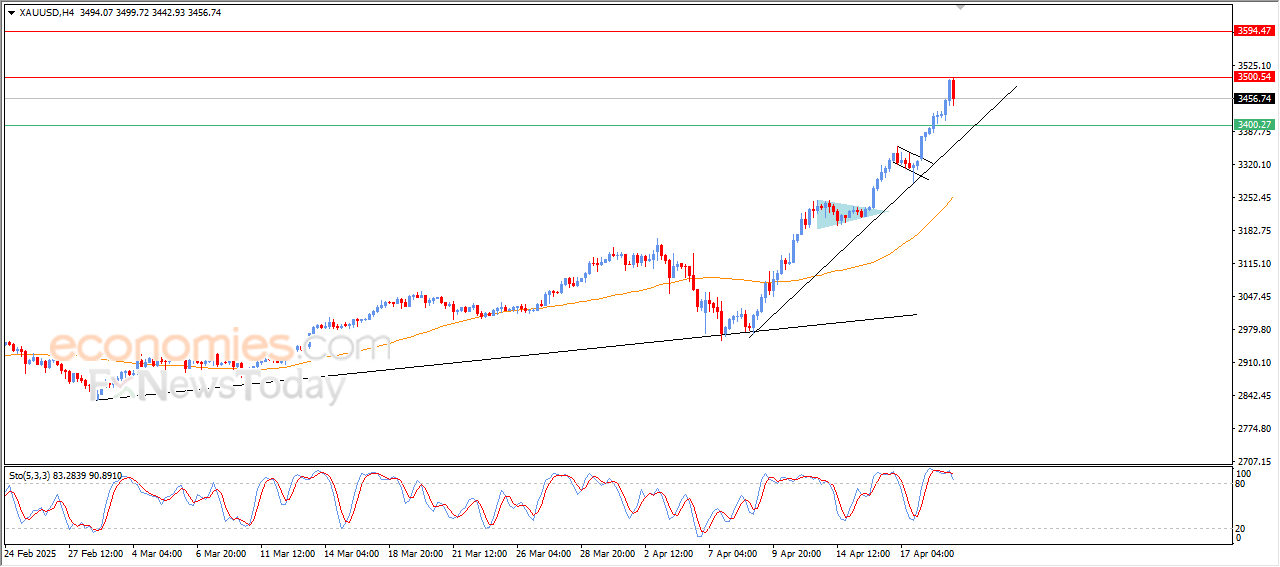
Gold price declined in its last intraday trading, and that after reaching our target at $3,500, to gather its gains and attempt to gain positive momentum that might assist it to breach this resistance, and attempting to offload its clear overbought conditions on the (RSI), and there are negative signals appear from them, amid its trading alongside bullish trendline sharply on the short term basis.
Do you need help in trading decisions? Do you want to learn how to start trading?
Join Economies.com VIP Club and benefit from over 15 years of market analysis expertise and get:
- Full coverage of commodities such as gold, oil, silver, and more
- Full coverage of all major forex currency pairs
- Full coverage of key global indices and stocks
- Full coverage of major cryptocurrencies and meme coins
- Accurate analysis and daily updated price forecasts
- Exclusive and breaking news
- Reliable trading ranges for effective risk management
- Comprehensive educational materials, competitions and prizes!
- Innovative tools to enhance your trading performance
Special Offer: Subscribe to the Economies.com VIP channel and get also a free subscription to a trusted trading signals channel provided by Best Trading Signal.
Forecast update for the EURUSD -22-04-2025

The EURUSD price witnessed sideways trading range on its intraday trading, in attempt to gain positive momentum that might assist it to recover and rise again, to lean on the main bullish trend line of the 60-minute time frame, accompanied by its stability at the support of its EMA50. and the (RSI) reached exaggerated oversold levels compared to the price move, beside the emergence of positive overlapping signals.
Do you need help in trading decisions? Do you want to learn how to start trading?
Join Economies.com VIP Club and benefit from over 15 years of market analysis expertise and get:
- Full coverage of commodities such as gold, oil, silver, and more
- Full coverage of all major forex currency pairs
- Full coverage of key global indices and stocks
- Full coverage of major cryptocurrencies and meme coins
- Accurate analysis and daily updated price forecasts
- Exclusive and breaking news
- Reliable trading ranges for effective risk management
- Comprehensive educational materials, competitions and prizes!
- Innovative tools to enhance your trading performance
Special Offer: Subscribe to the Economies.com VIP channel and get also a free subscription to a trusted trading signals channel provided by Best Trading Signal.
Gold Trading Signal Example 04-22-2025

Gold Trading Signal
- Trade: Buy Gold now at 3475
- Stop Loss: 60 pips
- Take Profit (1st target): 50 pips
- Take Profit (2nd target): 100 pips
- Open Target: Take profit at close
This signal is provided by Best Trading Signal, and we are not responsible for any losses. This is for illustrative purposes only.
Do you need help in trading decisions? Do you want to learn how to start trading?
Join Economies.com VIP Club and benefit from over 15 years of market analysis expertise and get:
- Full coverage of commodities such as gold, oil, silver, and more
- Full coverage of all major forex currency pairs
- Full coverage of key global indices and stocks
- Full coverage of major cryptocurrencies and meme coins
- Accurate analysis and daily updated price forecasts
- Exclusive and breaking news
- Reliable trading ranges for effective risk management
- Comprehensive educational materials, competitions and prizes!
- Innovative tools to enhance your trading performance
Special Offer: Subscribe to the Economies.com VIP channel and get also a free subscription to a trusted trading signals channel provided by Best Trading Signal.
The CADJPY keeps declining – Forecast today – 22-4-2025

The CADJPY kept providing negative trading, to remain stable below 61.8% Fibonacci correction level, which represents an extra barrier at 103.55, to notice by the above image, that it suffers clear losses by its stability near 101.50.
Notet that the main indicators unity by validating negative momentum, specifically reaching to 20 level, makes us prefer more of the negative trading, which might target 100.40 reaching 78.1% Fibonacci correction level at 99.45.
The expected trading range for today is between 100.40 and 102.40
Trend forecast: Bearish
Do you need help in trading decisions? Do you want to learn how to start trading?
Join Economies.com VIP Club and benefit from over 15 years of market analysis expertise and get:
- Full coverage of commodities such as gold, oil, silver, and more
- Full coverage of all major forex currency pairs
- Full coverage of key global indices and stocks
- Full coverage of major cryptocurrencies and meme coins
- Accurate analysis and daily updated price forecasts
- Exclusive and breaking news
- Reliable trading ranges for effective risk management
- Comprehensive educational materials, competitions and prizes!
- Innovative tools to enhance your trading performance
Special Offer: Subscribe to the Economies.com VIP channel and get also a free subscription to a trusted trading signals channel provided by Best Trading Signal.